8.760 unique artworks driven by soil data
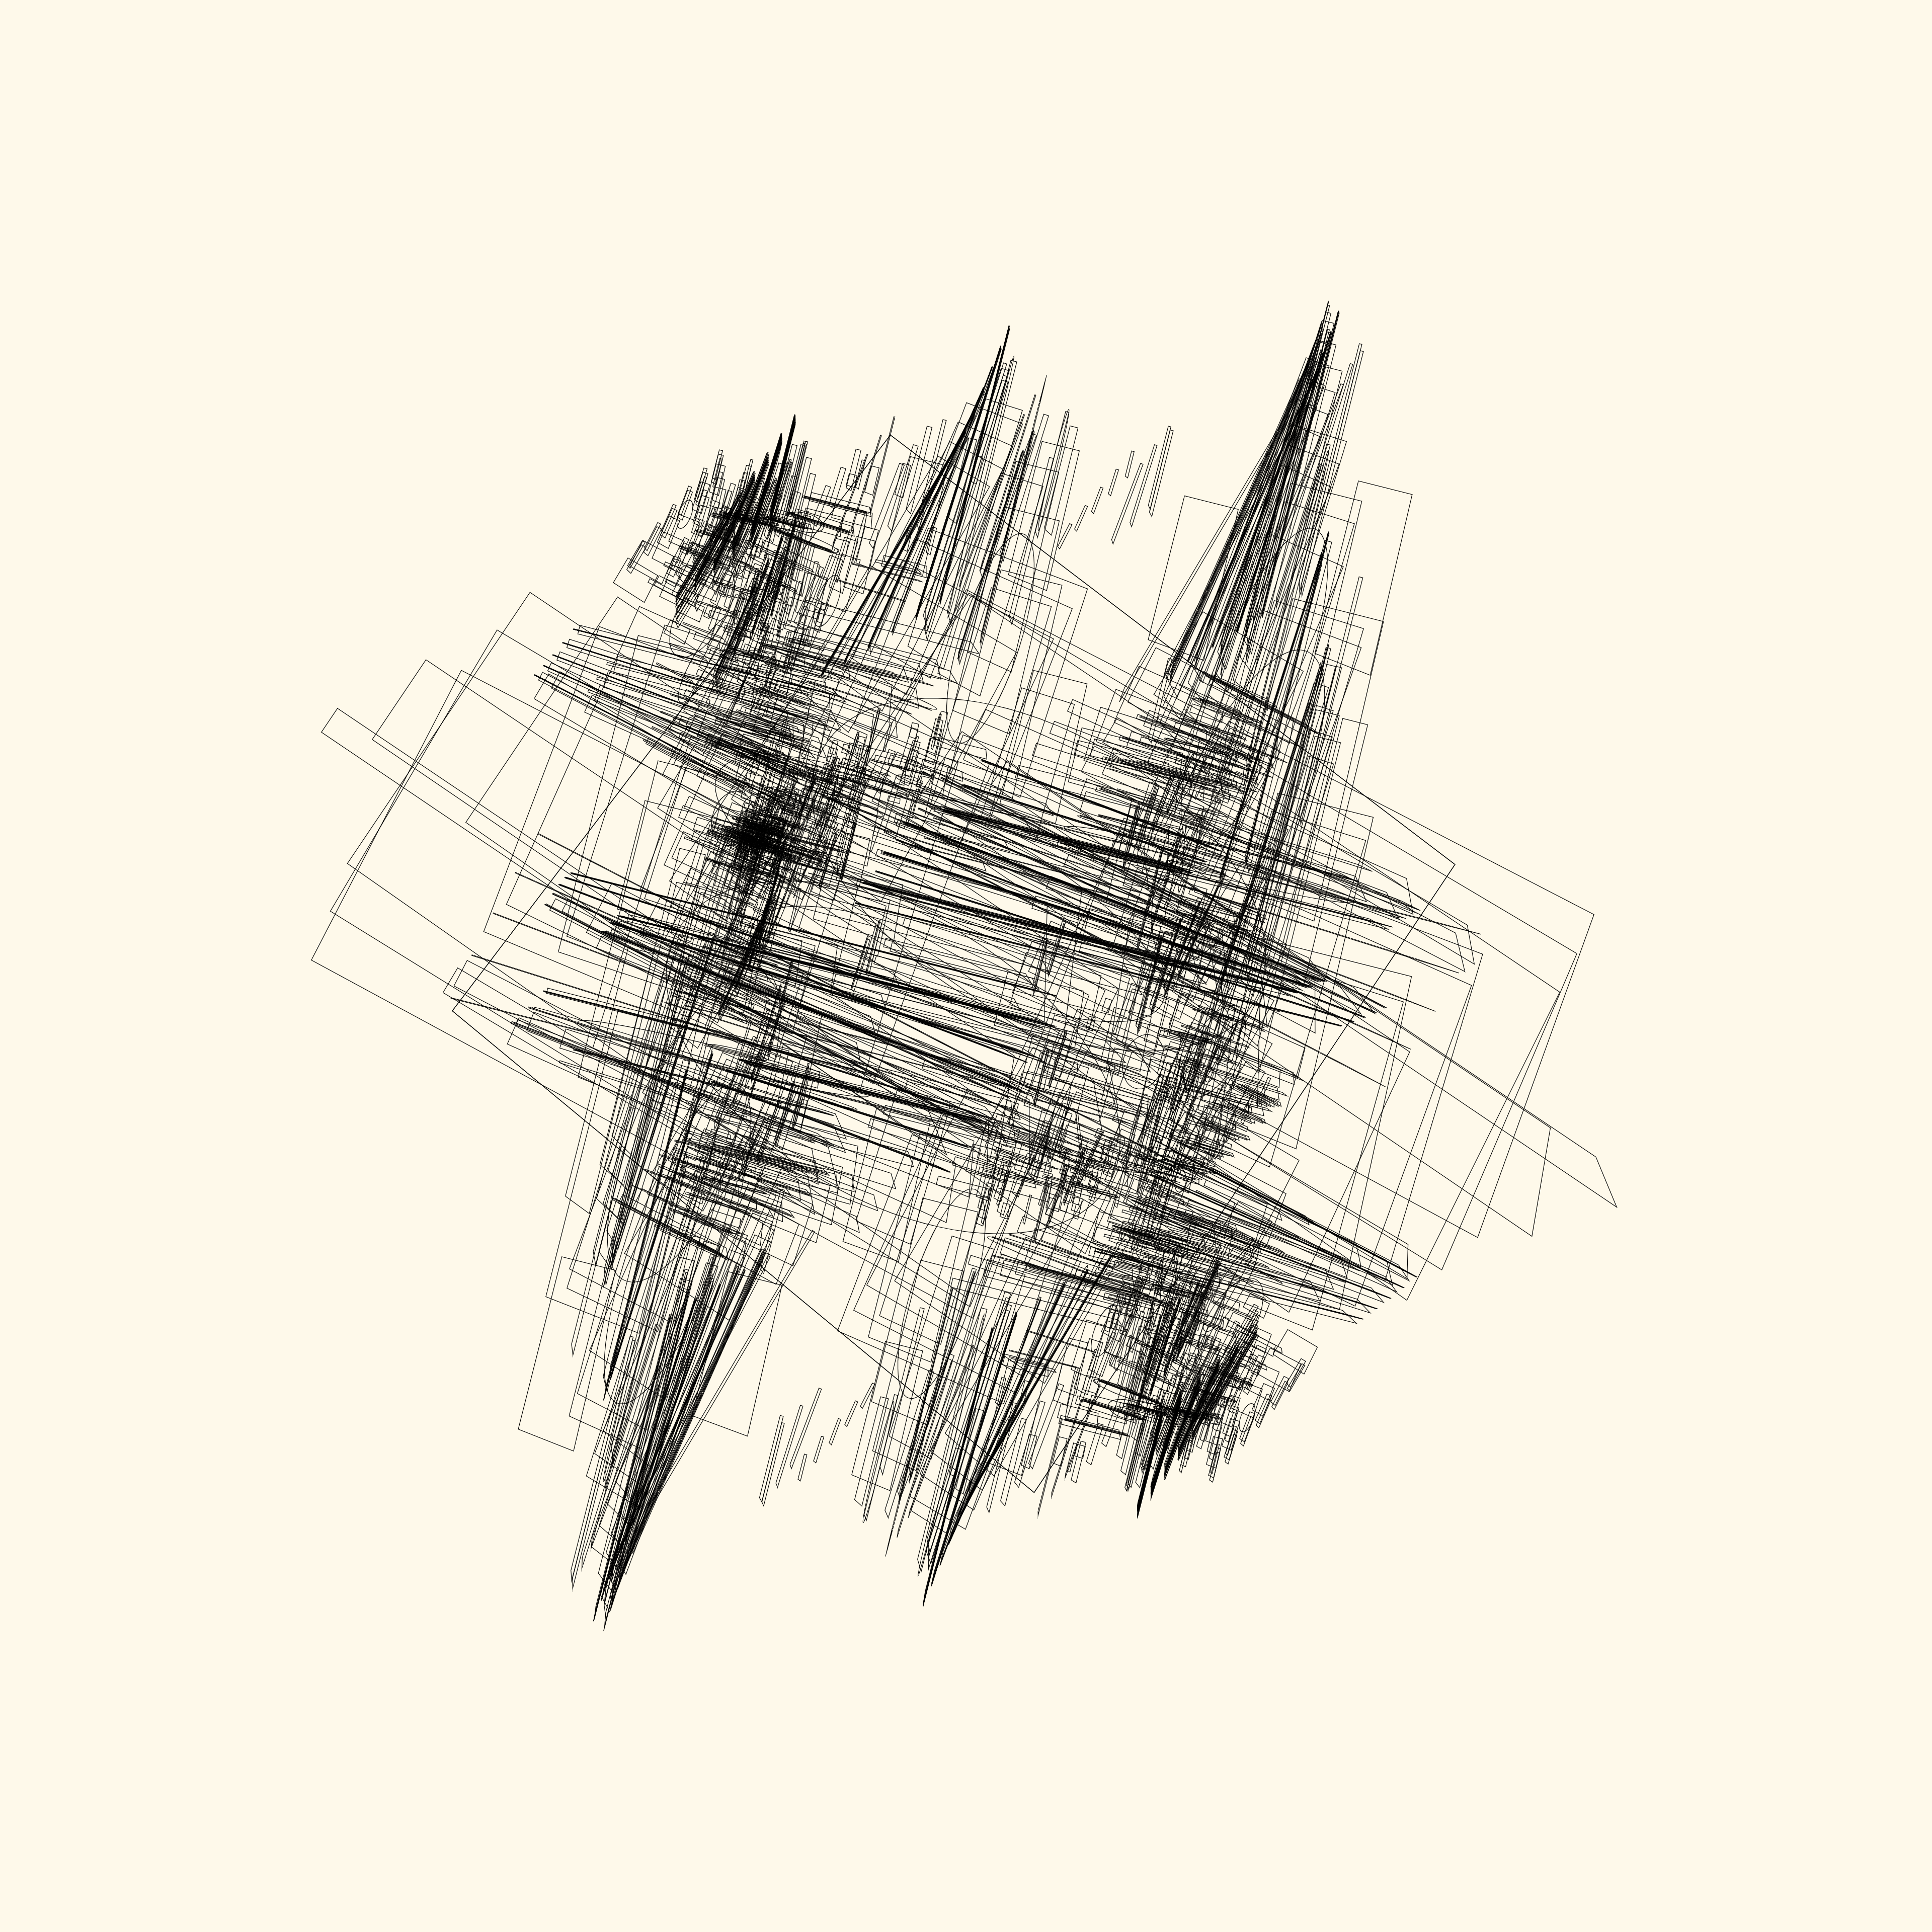
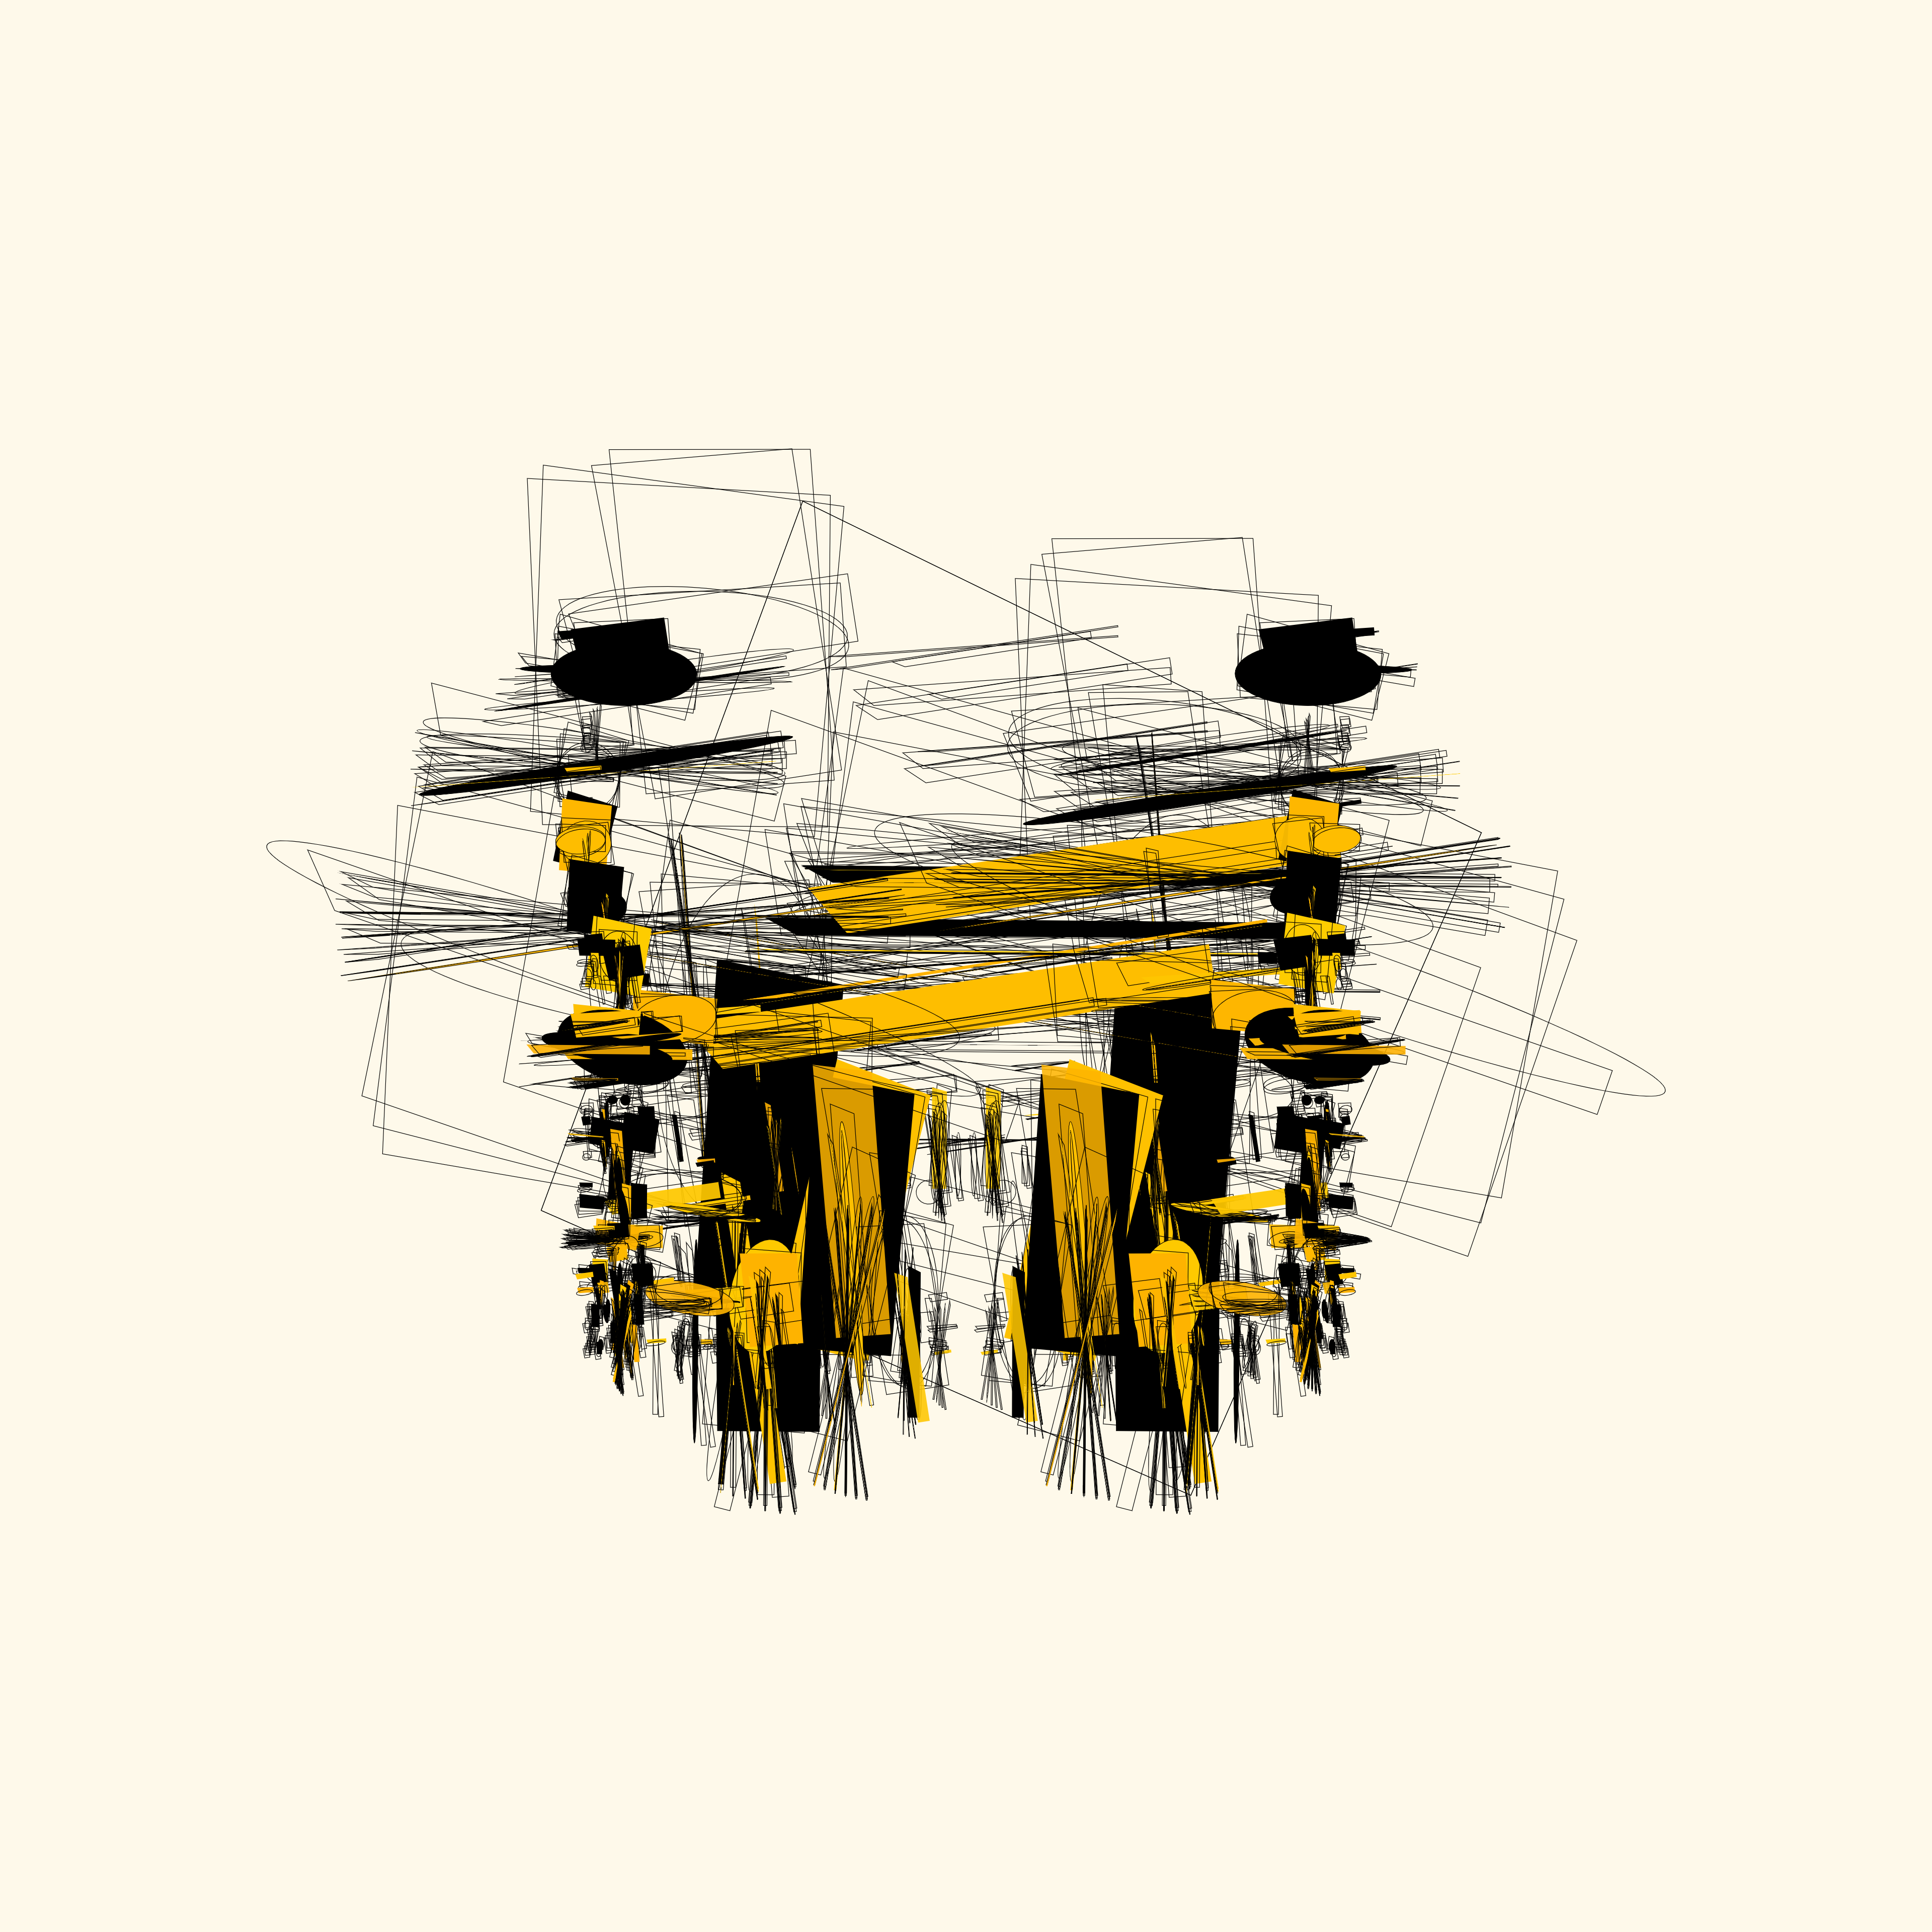
Next to the visual idententy for PONY EARTH we created 8.760 unique artworks driven by hundreds of biodiversity data points collected from a plot of farmland.
These are unique, high resolution artworks (seamlessly looping animations) based on a combination of different soil sample data and metereological data, numbered from 1 to 8760 with one for each hour between 2021-06-03 and 2022-06-03. 365 days x 24 hours = 8760. The Timestamp is present in the metadata. There are different categories of artworks ranging from rarest to most common, which only differ in style and visual attributes. The data is the same. Generally, rarer categories have more color, roundness, filled elements, symmetry and movement. Only category I (rarest) has a visible PONY EARTH Bee.
The PONY EARTH Bee as a symbol for diversity
The bee is generally placed according to the wind Wind Direction (°) data for the particular time/date. A wind direction of 0° (North) means the bee is placed above the image center, 90° (East) would be right of the image center. In the animations, the bee flies around its initial position in a loop. There are a few random flying patterns, circle, oval, twisted. The bee displaces the eDNA Visualization according to the Temperature (°C) data for the particular time/date. Warm temperatures will push away elements around the bee, cold temperatures pull them in towards the bee. The actual bee is visible only in the 100 rarest NFTs i.e. Category I. In all the other ones, the displacement and turbulence caused by the bee is still happening, but the bee itself is invisible.
Generated Artwork Specs
8.760 video loops, 3840 x 3840 px, 25fps, 12 sec
2.628.000 frames of video, 3840 x 3840 px
4 terabytes (TB)





If you want to read about the identity we designed for PONY EARTH click here.


